Google Charts in Visualforce Page
Biswajeet
March 27, 2018 1 Comment on Google Charts in Visualforce Page
Salesforce has built in component for charts in visualforce page, but the limitation is some types of charts are not available. In such cases, we can use Google Chart for different types of charts. Here is an example of Google Chart in visualforce page.
- You can find the list of all Google charts at Google Chart Gallery.
- Find the right chart as per your requirement and go through the documentation for the data requirements of the chart.
- You can download the Google Chart Javascript and upload it as a static resource, or you can direct call the Google Chart Javascript url in visualforce page.
- Every Google Chart requires data in specific format, create the right forma data in apex controller, before sending it to visualforce page Google Chart.
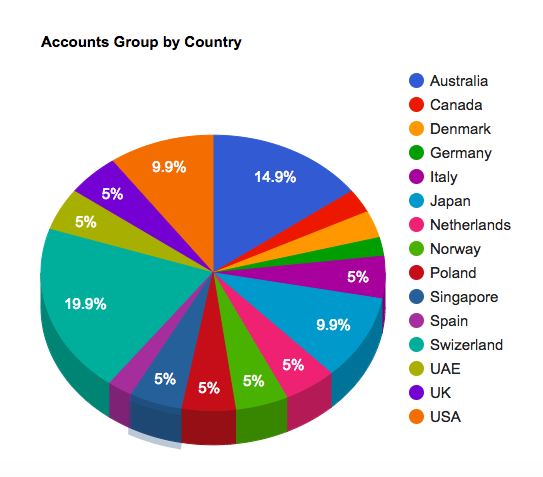
Example: In below example I’m showing number of Accounts group by Country in a 3D Pie Chart.
Apex Class:
global with sharing class AccountChartController {

    @RemoteAction
    global static List<AggregateResult> getAccountData(){
        List<AggregateResult> accGroupList = [Select BillingCountry Country, Count(Id) NumberOfAccounts
                                              From Account Where BillingCountry != null
                                              Group By BillingCountry];
        return accGroupList;
    }
}
Visualforce Page:
<apex:page controller="AccountChartController">
    <!--Google Chart Javascript Resource-->
    <script type="text/javascript" src="https://www.gstatic.com/charts/loader.js"/>

    <!--Javascript Remote Function To Call Apex Controller Method-->
        <script type="text/javascript">
            //Load google chart
            google.charts.load('current', {packages: ['corechart']});
    google.charts.setOnLoadCallback(drawChart);

    var accData; //Variable to store data
    //Call remote action method
    AccountChartController.getAccountData(function(result, event){
        accData  = result; //get data from apex controller
    },{escape:true});

    //Draw google chart
    function drawChart() {
        //Create the data table.
        var data = new google.visualization.DataTable();
        //Add datatable columns
        data.addColumn('string', 'Country');
        data.addColumn('number', 'Number of Accounts');

        //Add datatable rows
        for(i = 0; i< accData.length; i++){
            data.addRow([accData[i].Country, accData[i].NumberOfAccounts]);
        }

        //Set chart options
        var options = {
            'title':'Accounts Group by Country',
            is3D: true,};

        //Instantiate and draw the chart.
        var chart = new google.visualization.PieChart(document.getElementById('myPieChart'));
        chart.draw(data, options);
    }
    </script>

    <!--Identify where the chart should be drawn-->
    <div id="myPieChart" style="width: 900px; height: 700px;"/>
</apex:page>
